In today’s fast-moving digital world, data has become the fuel for business growth. Yet, for many businesses, data is scattered across spreadsheets, SaaS applications, databases and other business applications. This fragmentation leads to "sailing blind", inconsistencies, waste of time and missed opportunities.
Imagine if all your business data from CRM to finance, marketing to operations, was available in one central place, always up-to-date, and instantly ready for analysis.
That’s exactly what is possible with a central data platform, combined with a BI (Business Intelligence) reporting tool like Metabase, PowerBI, Superset, Looker or others.
If your company does not have this setup in place: it really can be a game-changer!
The reality: data is everywhere and nowhere
Most companies rely on a growing set of business tools: ERP, CRM, cloud storage, Excel files, marketing tools and more. Each of these tools holds valuable information but none of them tells the full story.
What’s worse:
- One-off exports create outdated data silos.
- Teams lose time searching for the latest version of a file.
- A lot of time has to be spent manually collecting data and creating reports from it.
- Critical decisions are made with incomplete or inconsistent information.
One-off exports create outdated data silos.
Teams lose time searching for the latest version of a file.
A lot of time has to be spent manually collecting data and creating reports from it.
Critical decisions are made with incomplete or inconsistent information.
This jungle of disconnected systems leads to a lack of a "single source of truth", a major blocker for data-driven decision-making
The solution: centralize, transform and use your data
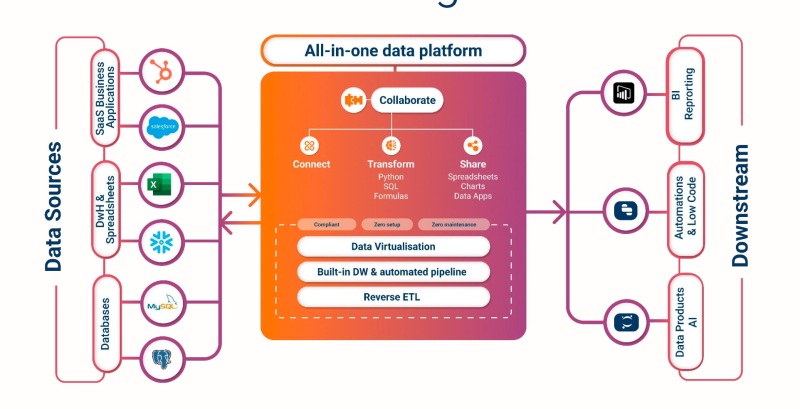
All-in-one data platforms empower companies to bring all their data together into one secure, cloud-based environment. With a central data warehouse, you can finally connect the dots between all your business systems.
Here's how it works:
- Connect: link all your data sources, SaaS tools, Excel files, databases, APIs and more.
- Transform: clean, combine and enrich your data in a handy spreadsheet-like interface.
- Use: real-time dashboards, automated alerts and custom reports to drive insights and action across your teams.
Connect: link all your data sources, SaaS tools, Excel files, databases, APIs and more.
Transform: clean, combine and enrich your data in a handy spreadsheet-like interface.
Use: real-time dashboards, automated alerts and custom reports to drive insights and action across your teams.
This full-stack approach includes data ingestion (ETL), transformation, reverse syncs, observability and dashboarding capabilities, all in one interface.
Unlock insights with a BI reporting tool
Once your data is centralized, you need a way to explore and visualize it, and that’s where a BI reporting tool comes in. The most known is Microsoft PowerBI but good alternatives are Metabase, Superset and Looker.
Metabase is an open-source business intelligence (BI) platform that has these advantages:
- No coding required: create dashboards and reports with a point-and-click interface.
- Powerful query builder: non-technical users can ask questions like “Which products had the most sales last month?” without writing SQL queries.
- Data visualization made easy: choose different graph types like bar charts, heatmaps, funnel charts, maps and more.
- Embedded analytics: you can embed "live" dashboards into your own applications or websites.
- Automatic email reports: you can set up emails to automatically deliver dashboards to your team or clients.
No coding required: create dashboards and reports with a point-and-click interface.
Powerful query builder: non-technical users can ask questions like “Which products had the most sales last month?” without writing SQL queries.
Data visualization made easy: choose different graph types like bar charts, heatmaps, funnel charts, maps and more.
Embedded analytics: you can embed "live" dashboards into your own applications or websites.
Automatic email reports: you can set up emails to automatically deliver dashboards to your team or clients.
For power users, Metabase also supports native SQL queries and custom dashboards, making it both beginner-friendly and technically capable.
When combined with the right all-in-one data platform to centralize and transform data, Metabase becomes the perfect tool to surface those insights with speed and clarity.
Your next step to become data-driven
At Sevendays, we believe that empowering companies with the right data tools creates a ripple effect: better decisions, more efficiency, happier customers, and faster growth.
✅ Centralizing your data with an All-in-one data platform
✅ Visualizing your insights with a BI tool
✅ Activating results through automation and collaboration
It's no longer a luxury, it’s a necessity for staying competitive.
Ready to turn your business data into a real-time engine for growth? Let’s talk.